top of page

TEST DATA


Background To The Analysis Of Test Data
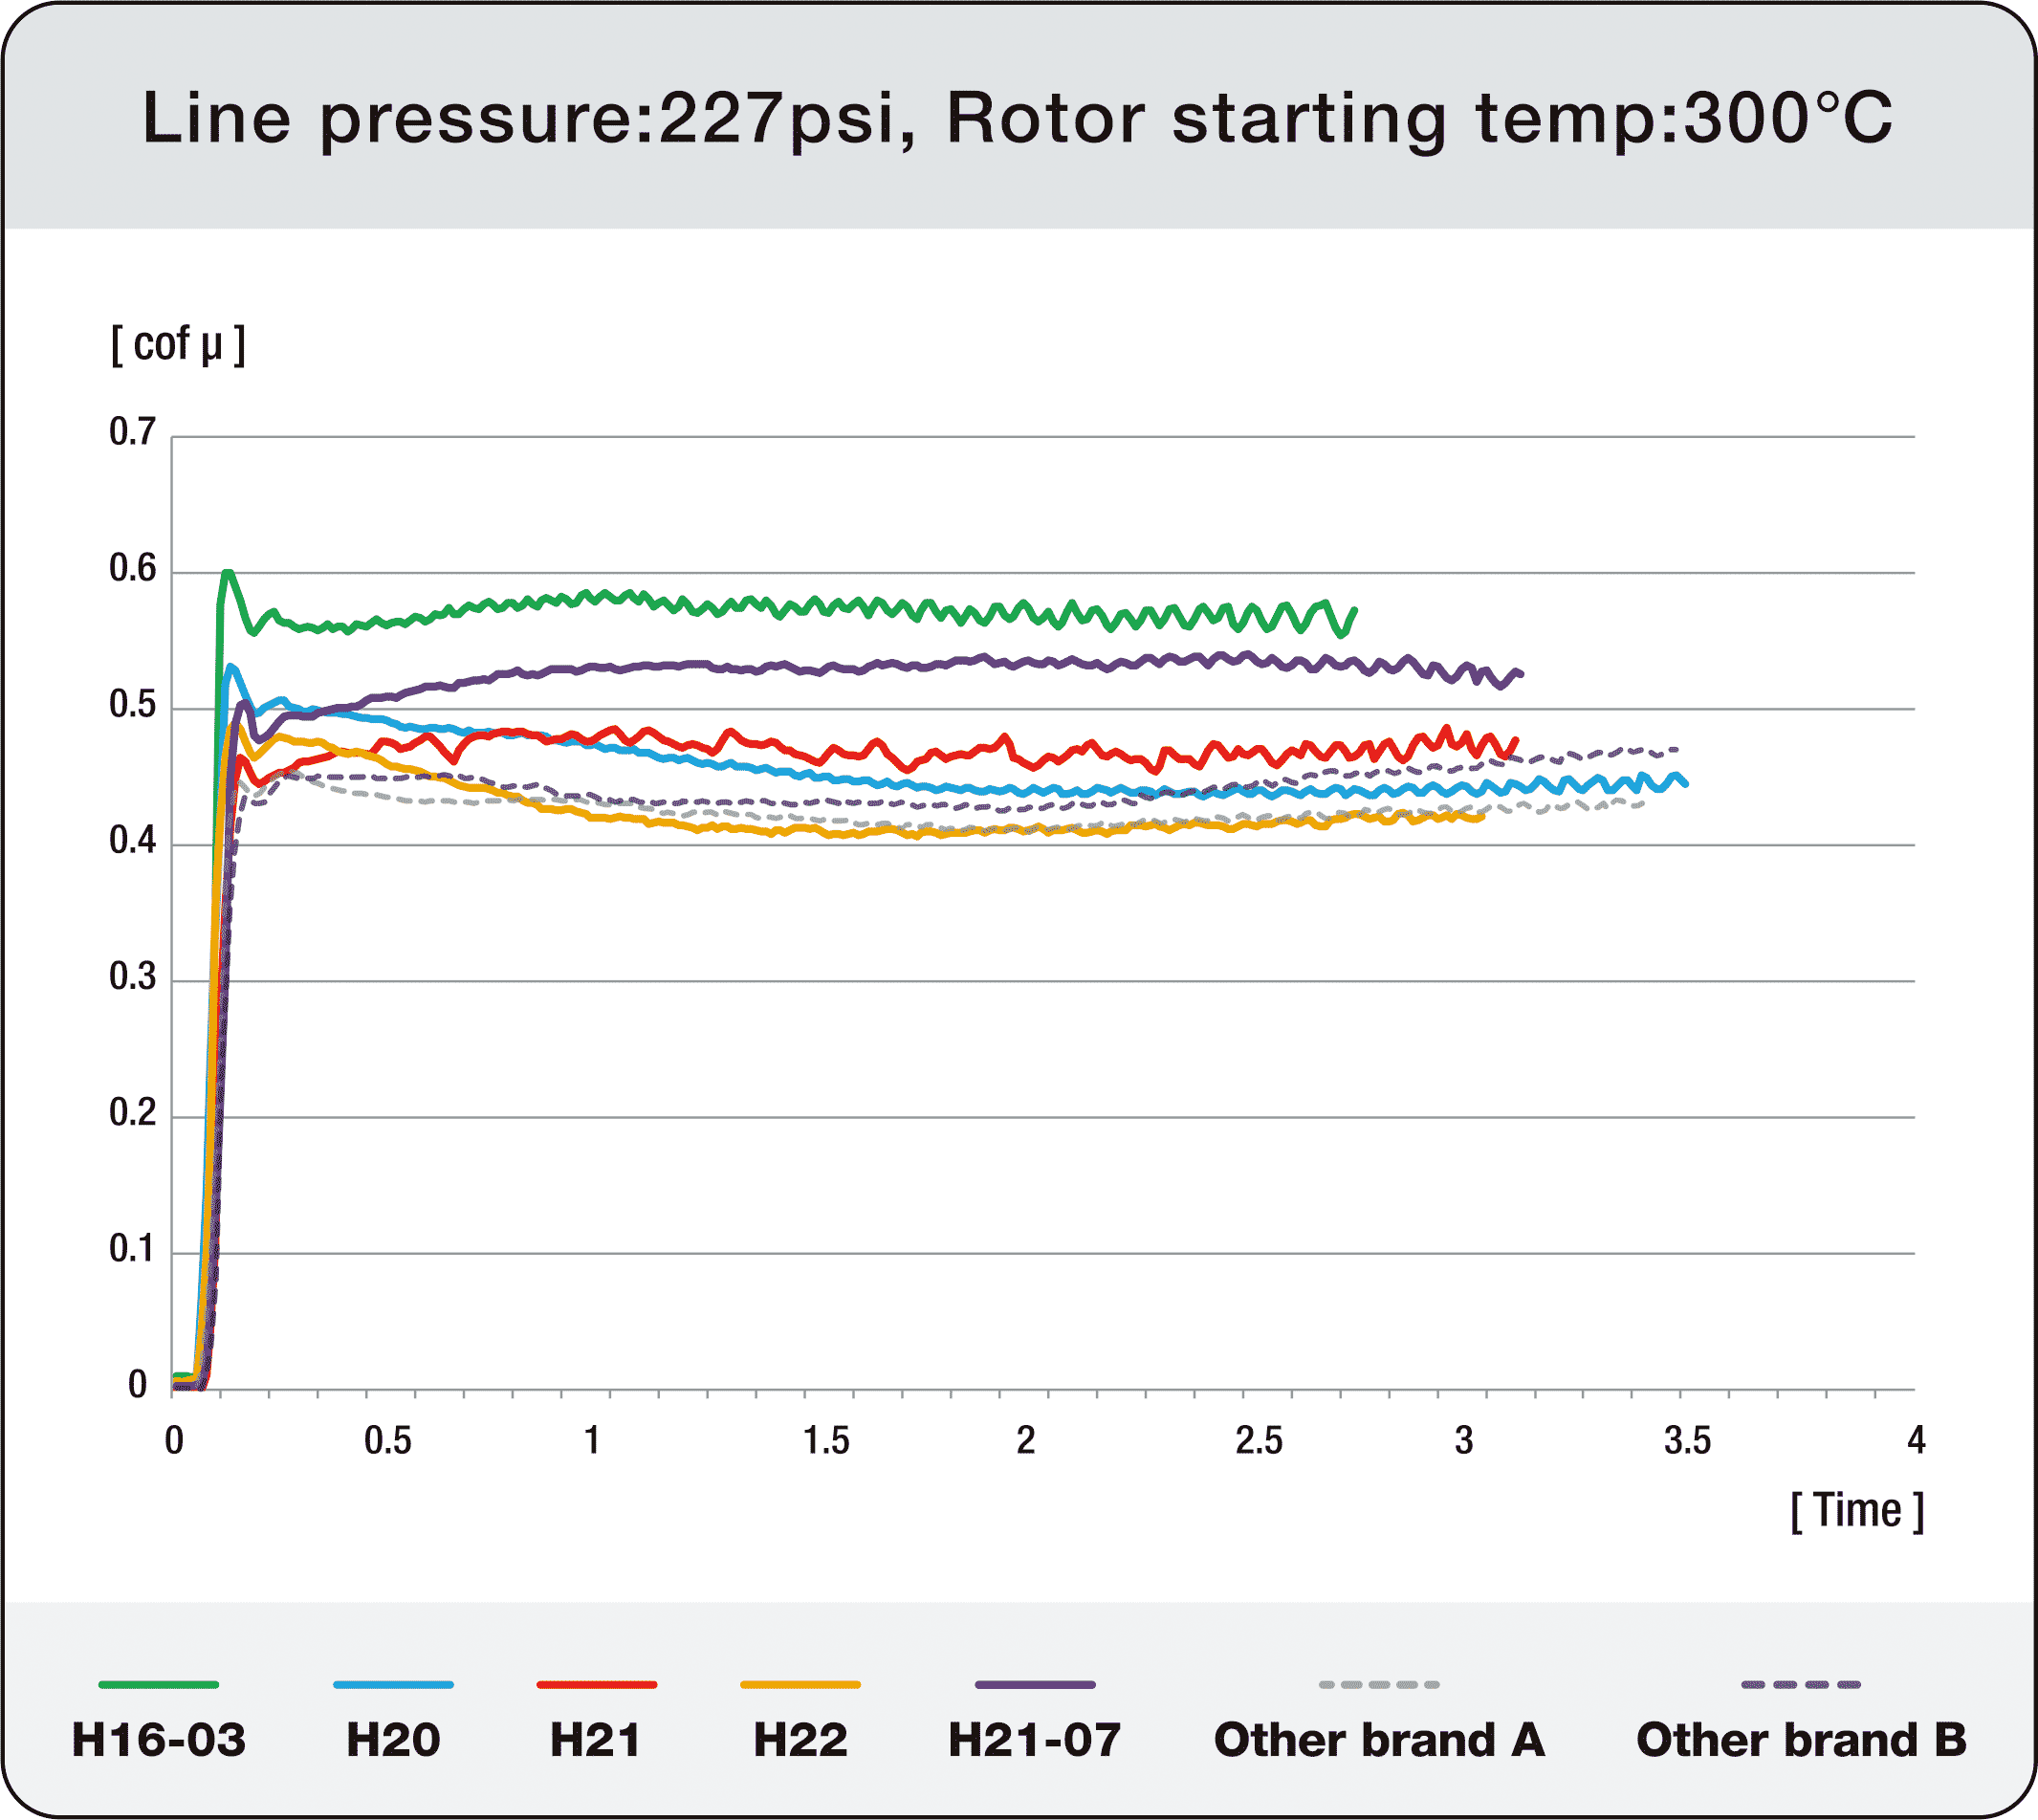
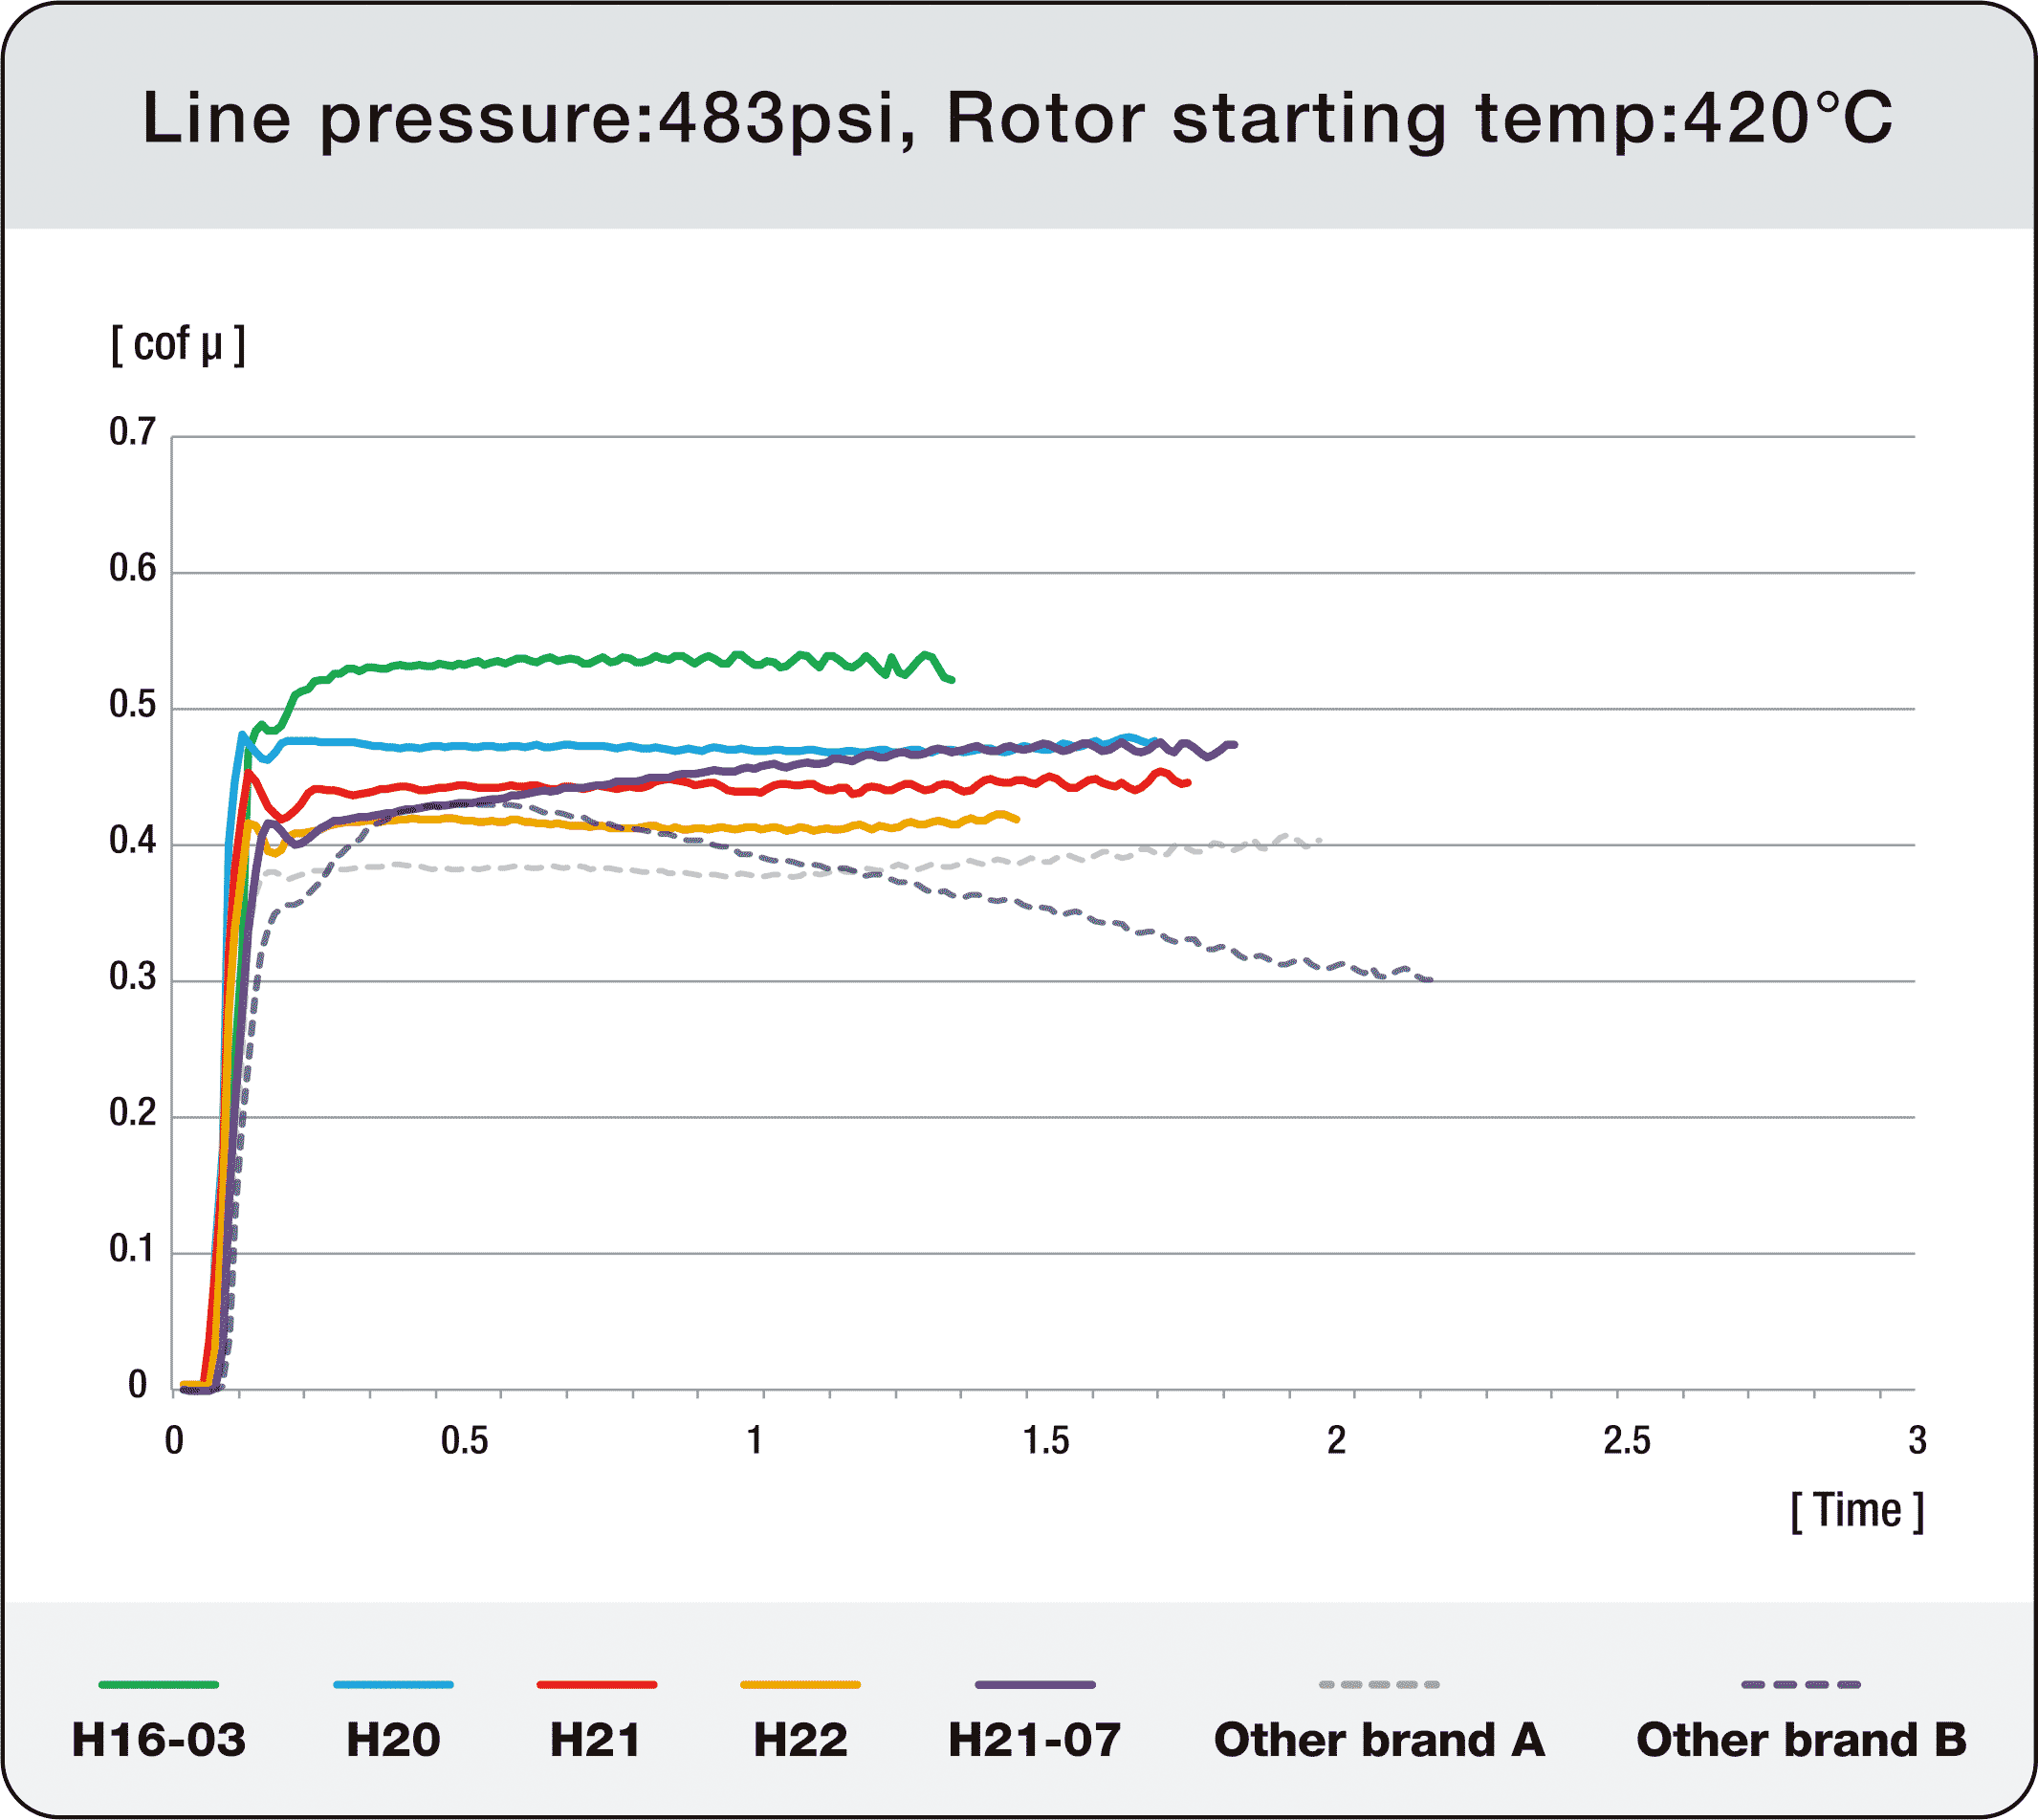
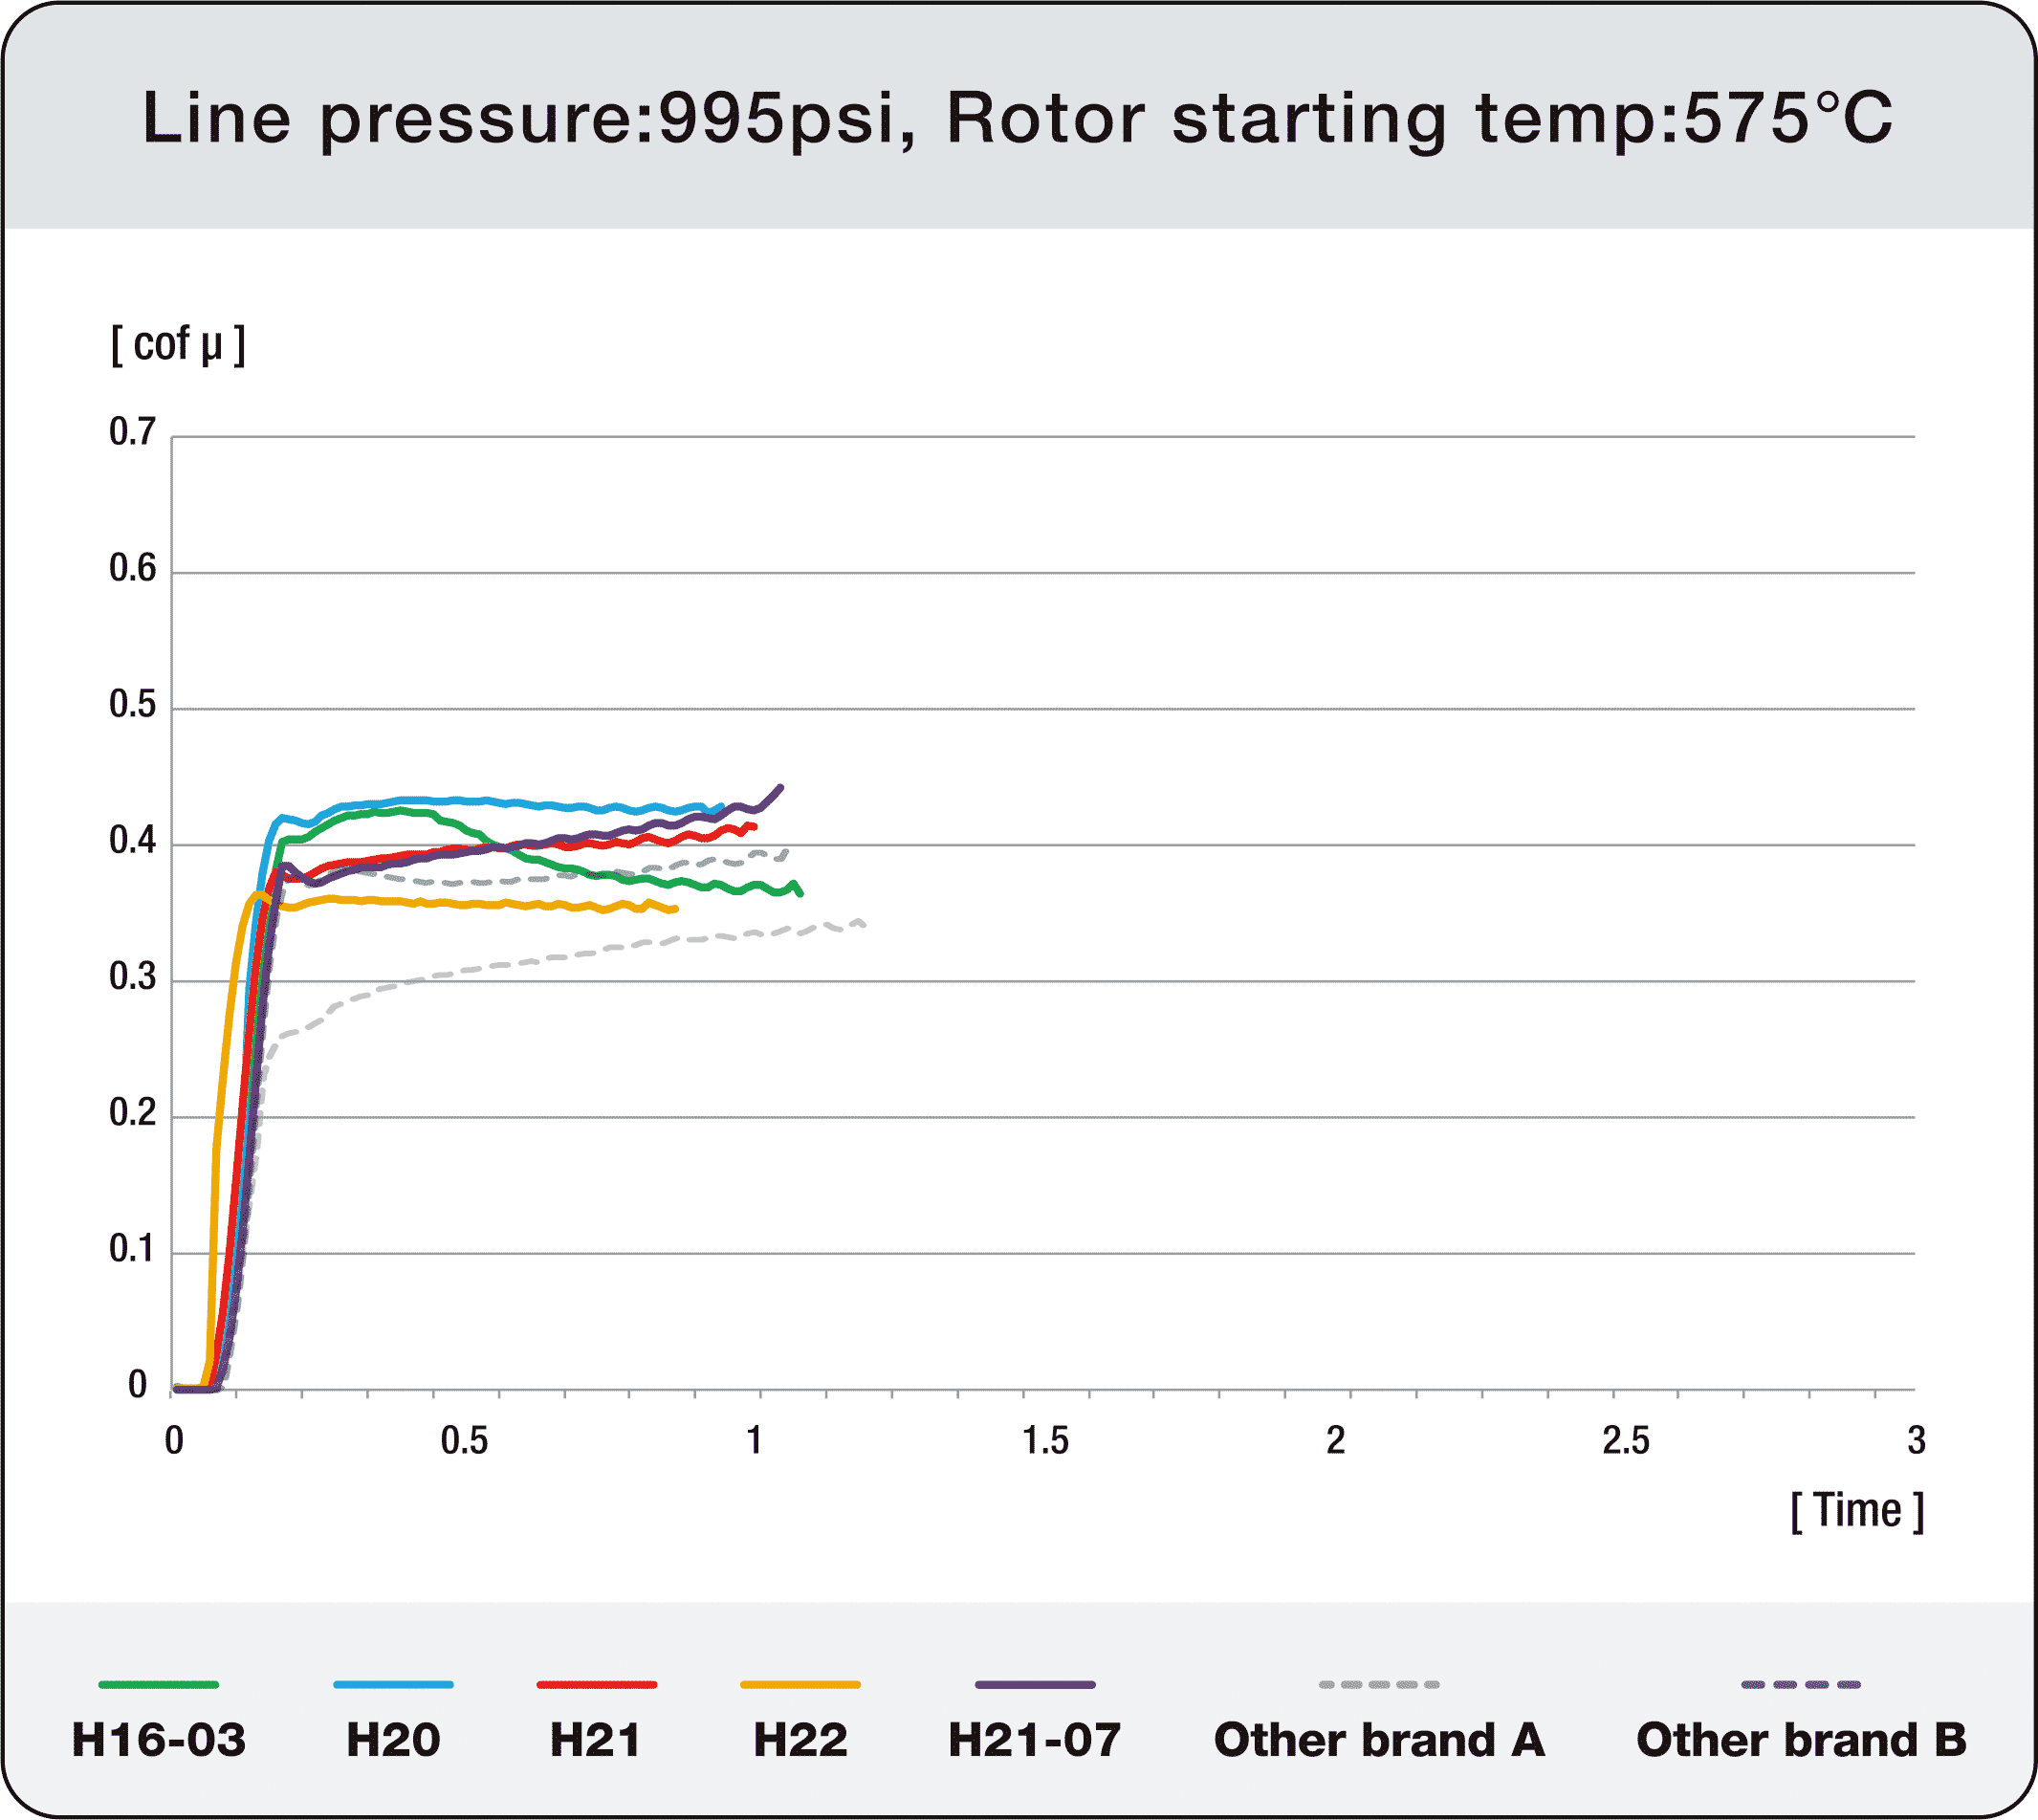
The brake performance graphs are taken directly from the raw data as processed by the full-scale dyno.
The disc is run up to a road speed of 220 km/h, then a constant brake pressure is applied until a speed of 110 km/h is reached.
This test is repeated ten times each from starting rotor temperatures of 300℃, 420℃, 525℃ and 575℃.
The graphs show each of the tenth.
The coefficient of friction is derived from the measured braking torque, the clamping force applied to the brake pads, and the effective radius of the geometric center of the pads.
bottom of page
